Authors: Carsten L. Loseke, Graduate Student; Rebecca L. McDermott, Research Technician; Josh R. Benton, Beef Feedlot Unit Director, ENREEC; Keara O’Reilly, Research Assistant Professor; Galen E. Erickson, Professor; Jim C. MacDonald, Professor, Animal Science, Lincoln.
Summary with Implications
Bunk management is crucial for modern feedlots, and understanding the ideal time to target a slick bunk is important. A feedlot study compared the effect of providing finishing cattle with 12, 15, 18, 21, or 24 hours of access to feed on performance, carcass characteristics, feeding behavior, and ruminal pH. As access time to feed increased, feed intake and day-to-day variation of feed intake increased linearly, while gain and feed conversion were unchanged. Cattle with greater access time to feed spent more time per day at the bunk, and consumed feed more slowly. A cubic effect on average ruminal pH was observed, with cattle that had 12 hours of feed access having the highest pH, and cattle that had 15 and 18 hours of feed access having the lowest pH. Reducing access time to feed maintained intake with no loss in gain if access was greater than 15 hours, but reduced feed access time did not improve feed conversion.
Introduction
The effect of various feed bunk management strategies, with differences in the ideal time to target a slick bunk, on feed intake and feedlot cattle performance is a commonly debated topic in the feedlot industry. The goals of commercial feed bunk management strategies are to maximize dry matter intake, reduce feed wastage, and limit feed intake variation. A positive correlation between high day-to-day variation in feed intake and subacute acidosis, which detrimentally impacts overall feedlot performance, has been reported in previous research (1998 Nebraska Beef Report, pp. 71-75). Feedlots commonly apply clean bunk management with a time targeted slick bunk system, or a modified ad-libitum system that targets a slick bunk or “crumbs” at the time of first feeding. While both systems attempt to maximize cattle performance, it is unclear how these strategies affect feeding behavior of cattle and their subsequent performance. Feed bunk management research has historically applied treatments through a bunk scoring system and adjustments to feed calls which is never 100% accurate. Research on feed availability by access time in a mechanical system is limited. Therefore, the objective of this experiment was to evaluate how feed availability, based on access times of 12, 15, 18, 21 or 24 hours per day to the feed bunk, affects feedlot performance, carcass characteristics, feeding behavior, and ruminal pH of yearling heifers.
Procedure
A finishing study was conducted at the Eastern Nebraska Research Extension and Education Center near Mead, Nebraska, using crossbred yearling heifers (n = 234; initial BW = 984 lb, SD = 79 lb) in a randomized complete block design. Heifers were limit-fed a diet of 50% alfalfa and 50% Sweet Bran® for five days at approximately 2% of BW to equalize gut fill, then weighed individually for two consecutive days, with heifers being vaccinated, dewormed, and implanted with Revalor-XH (Merck Animal Health) on the second day. Heifers were housed in 1 of 8 pens each equipped with 5 electronic feed bunks (Insentec Roughage Intake Control System, Hokofarm Group, Netherlands). Heifers were blocked by body weight (BW) and assigned to 1 of the 8 pens (n = 28-30/pen), with each pen representing a separate BW block. After placement in pens, and before trial initiation, heifers underwent a 27-day training period on a high forage diet to learn to use the electronic feed bunks, and heifers were assigned randomly to one of five feed bunks within each pen (n = 5-6 head/bunk). At trial initiation, heifers were limit-fed a second time for five days at 2% of BW, followed by collection of individual BW for two consecutive days, and the average of these two-day weights was used for initial BW. At trial initiation, each bunk was assigned randomly to one of the five treatments with 8 bunks per treatment (n = 44-48 heifers/treatment).
The five treatments were based on the number of hours that the heifers had access to the feed bunks each day, either 12, 15, 18, 21, or 24 hours, with access time for all treatments beginning at 0830. At 0830, heifers of all treatments were able to access their assigned bunk and feeding time would expire at 2030, 2330, 0230 the following day, or 0530 the following day, for the 12-, 15-, 18-, and 21-hour treatments respectively. Each feed bunk has a pneumatic access slide to allow cattle to access the feed, a sensor, and an antenna to detect the heifer’s unique radio frequency electronic identification (EID) tag. The access slide opened if the sensor detected the presence of the animal, detected the EID tag and the tag was programmed to have access to that feed bunk. The pneumatic access slide closed once the animal removed its head from the bunk and the sensor no longer detected the animal’s presence, ensuring that only one animal had access to the feed bunk at a time. After the expiration of access time, the pneumatic access slide would not drop to allow eating access when the heifers EID tags were scanned. Heifers were not able to consume feed from bunks of the incorrect treatment as bunk access slides would close each time an animal left the bunk, and only open for heifers correctly assigned to that bunk.
Heifers were adapted to a finishing diet over 17-days using three adaptation diets (fed for 6, 5, and 6 days). Grass hay was stepped down from 15%, 10%, 5%, to 0% (DM basis), corn silage was stepped down from 34%, 28%, 22%, to 15% (DM basis), and these roughages were replaced by a 50:50 blend of dry-rolled and high-moisture corn. Modified distillers grains and supplement were included in all diets at 15 and 5% of the diet DM respectively. All heifers were fed the same diets throughout the entire trial. The finishing diet (Table 1) was fed for 87 days, with heifers on feed during the trial for a total of 104 days. The beef NASEM model (2016) was used to ensure the diets met or exceeded the metabolizable protein requirements of heifers, and urea was added at 0.8% of the total diet DM to ensure adequate rumen degradable protein.
Data recorded by the electronic feeding system were provided by the Hokofarm data management software (Apollo), which provided individual animal event data including the animal identification number, feed intake, and visit duration for each feeding event. Using these data, individual animal dry matter intake (DMI), and bunk visit (BV) frequency and duration were calculated. Bunk visit frequency was determined as the number of BV events that were recorded during a 24-h period, regardless of whether feed was consumed. Bunk visit duration was defined as the sum of the duration of BV events recorded during a 24-h period. The BV eating rate was computed as the ratio of daily DMI to daily BV duration. Day-to-day variation of DMI and feeding behavior traits were expressed as the coefficient of variation for each heifer. The coefficient of variation was computed as the standard deviation of the respective trait across days for each heifer divided by the average of the trait expressed as a percentage. Ruminal pH measurements were recorded every 10 minutes by Moonsyst pH boluses (n = 3-4 heifers/treatment; Moonsyst International, Kinsale, Ireland). Minimum, maximum, average, and variance values are the variable's respective mean values taken from 24-hour periods across days. Heifers were harvested at a commercial abattoir (Greater Omaha, Omaha, Nebraska) where hot carcass weight (HCW) and liver abscess scores were recorded on day of harvest. Marbling score, ribeye area (REA), and 12th rib fat thickness were collected after a 48-hour chill. Final BW was calculated from HCW using a common 63% dressing percentage.
Performance, carcass characteristics, feeding behavior, and ruminal pH data were analyzed using the MIXED procedure of SAS (SAS Institute, Inc., Cary, NC), with treatment and pen (BW block) as fixed effects, and individual animal as the experimental unit. Incidence of liver abscesses were analyzed as a binomial distribution and a logit-link function using the GLIMMIX procedure of SAS with treatment and pen as fixed effects. Orthogonal contrasts were used to test linear, quadratic and cubic effects of feed bunk access time. Significance was declared when P ≤ 0.05 and tendencies when 0.05 < P ≤ 0.10.
Ingredient, % of diet DM | |
Dry-Rolled Corn | 32.5 |
High Moisture Corn | 32.5 |
Corn Silage | 15 |
MDGS2 | 15 |
Supplement3 | 5 |
| 1Finishing ration for the trial fed for final 87 days. 2Modified distillers grains plus solubles. 3Supplement provided Rumensin (30 g/ton DM), Tylan (8.8 g/ton DM) and melengestrol acetate (0.5 mg/heifer daily), minerals and vitamins to meet or exceed cattle requirements, and urea for rumen degradable protein requirements. | |
Results
Performance and Carcass Characteristics
As feed access time increased (Table 2), ADG and HCW numerically increased from 12 to 15 hours of feed access and remained relatively constant as feed access time increased from 15 to 24 hours, however there was no significant quadratic effect on ADG (P = 0.12), carcass adjusted final BW (P = 0.11), or HCW (P = 0.11). From 12 to 24 hours of access to feed, DMI increased linearly (P < 0.01), with 15-, 18-, 21-, and 24-hour feed access heifers having a 3.4%, 4.1%, 5.3%, and 4.9% greater DMI than heifers with 12-hour access, respectively. Feed conversion was not significantly different (P > 0.20) as feed access time increased. The day-to-day variation (CV) of DMI increased linearly (P = 0.02) from 15.4% in the 12-hour treatment to 16.6% in the 24-hour treatment. Marbling score, ribeye area and fat thickness were unaffected by treatment. As feed access time increased, the percent incidence of liver abscesses increased linearly (P = 0.03).
Treatments1 | Orthogonal contrast P-value | ||||||||
| Item | 12 | 15 | 18 | 21 | 24 | SEM2 | Linear | Quadratic | Cubic |
| Performance | |||||||||
| Initial BW3, lb | 987 | 981 | 990 | 985 | 980 | 5.2 | 0.60 | 0.52 | 0.34 |
| Final BW4, lb | 1354 | 1382 | 1375 | 1381 | 1369 | 11.6 | 0.44 | 0.11 | 0.64 |
| ADG, lb | 3.53 | 3.86 | 3.71 | 3.82 | 3.74 | 0.099 | 0.24 | 0.12 | 0.34 |
| DMI, lb/d | 26.6 | 27.5 | 27.7 | 28.0 | 27.9 | 0.40 | <0.01 | 0.20 | 0.84 |
| F:G5 | 7.52 | 7.14 | 7.46 | 7.35 | 7.52 | - | 0.64 | 0.23 | 0.22 |
| CV of DMI6, % | 15.4 | 15.1 | 16.5 | 16.0 | 16.6 | 0.47 | 0.02 | 0.97 | 0.76 |
| Carcass characteristics | |||||||||
| HCW, lb | 853 | 871 | 866 | 870 | 862 | 7.3 | 0.43 | 0.11 | 0.63 |
| Marbling Score7 | 635 | 606 | 655 | 652 | 641 | 17.6 | 0.29 | 0.80 | 0.12 |
| 12th-rib fat, in | 0.65 | 0.64 | 0.68 | 0.66 | 0.70 | 0.025 | 0.12 | 0.83 | 0.94 |
| Ribeye area, in2 | 13.8 | 13.9 | 13.8 | 13.5 | 13.8 | 0.20 | 0.55 | 0.68 | 0.29 |
| Liver abscess incidence, % | 3.5 | 6.0 | 11.3 | 7.2 | 18.4 | 6.0 | 0.03 | 0.98 | 0.50 |
| 1Treatments are listed in hours of access to feed. All heifers were allowed access to the feed bunks at 0830 each day and were mechanically locked out from feed after the designated treatment access time. 2Standard error of the mean. 3Initial BW was calculated as the average of the two-day individual weights at trial initiation. Heifers were limit fed five days prior to weighing. 4Final BW was calculated using HCW and a common dress for heifers of 63%. 5Analyzed as G:F, the reciprocal of F:G. 6Day-to-day coefficient of variation (CV) = standard deviation / mean (individual heifer across days). 7Marbling Score: 400 = Small00, 500 = Modest00, 600 = Moderate00, etc. | |||||||||
Feeding Behavior
As feed access time increased from 12 to 24 hours (Table 3), time spent at the bunk increased linearly (P < 0.01) and eating rate decreased linearly (P < 0.01). The 15-, 18-, 21-, and 24-hour feed access heifers spent 7.3, 10.1, 7.9, and 12.4 minutes more at the bunk per day respectively, than the 12-hour treatment. The heifers given 12 hours of feed access time ate 14.0% faster than the heifers given 24 hours access to feed. Day-to-day variation for BV frequency had a cubic effect (P = 0.02) and variation in BV duration increased linearly (P < 0.01) as access to feed time increased.
Treatments1 | Orthogonal contrast P-value | ||||||||
Item | 12 | 15 | 18 | 21 | 24 | SEM2 | Linear | Quadratic | Cubic |
| Bunk Visit (BV) traits3 | |||||||||
| BV frequency, events/d | 29.8 | 26.6 | 26.6 | 30.0 | 25.7 | 1.44 | 0.27 | 0.82 | 0.01 |
| BV duration, min/d | 69.1 | 76.4 | 79.2 | 77.0 | 81.5 | 2.00 | <0.01 | 0.14 | 0.07 |
| BV eating rate, g/min | 182 | 171 | 161 | 169 | 159 | 4.9 | <0.01 | 0.28 | 0.21 |
| Day-to-day variation of traits | |||||||||
| BV frequency CV4, % | 33.0 | 32.6 | 35.6 | 36.8 | 33.5 | 1.06 | 0.12 | 0.05 | 0.02 |
| BV duration CV4, % | 25.0 | 25.3 | 27.7 | 29.2 | 29.0 | 0.92 | <0.01 | 0.54 | 0.17 |
| 1 Treatments are listed in hours of access to feed. All heifers were allowed access to the feed bunks at 0830 each day and were mechanically locked out from feed after the designated treatment access time. 2Standard error of the mean. 3Bunk visit data recorded by Insentec Roughage Intake Control bunks each time a heifer’s EID was scanned. 4Day-to-day coefficient of variation (CV) = standard deviation / mean (individual heifer across days). | |||||||||
Ruminal pH
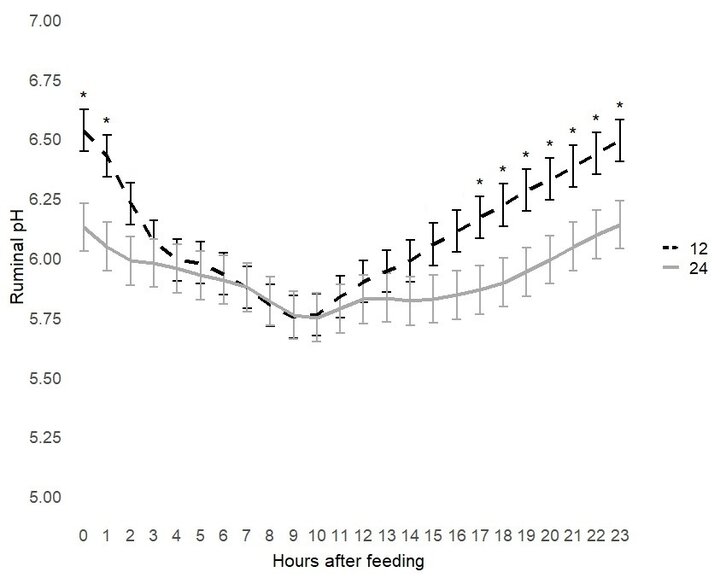
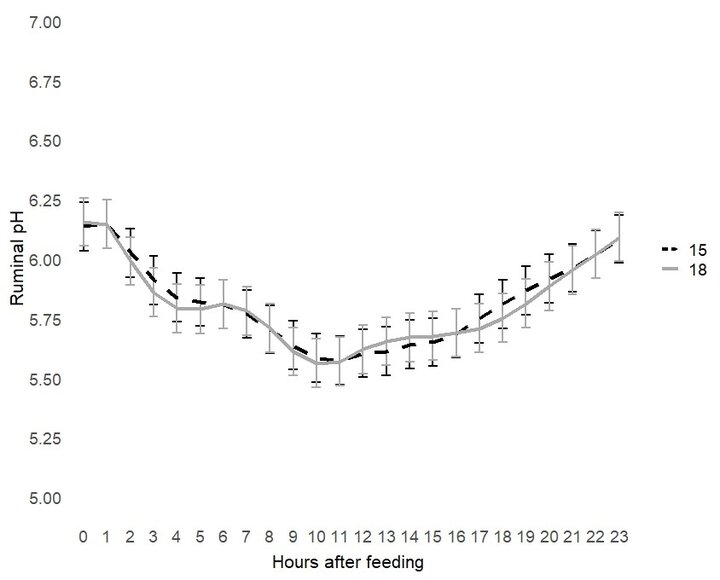
In a subsample of the population during the finishing period (Table 4), average ruminal pH and maximum pH within a day had a cubic effect (P = 0.05), such that the 12-hour treatment heifers had the highest and 15 and 18-hour treatment heifers had the lowest rumen pH. Day-to-day variation in rumen pH was not significantly different (P > 0.05), and variation tended to be highest in the 15 and 18-hour treatments, and the lowest in the 12-hour treatment. The magnitude of pH change from maximum to minimum decreased linearly as access to feed time increased (P < 0.01). The 12-hour treatment prior to feeding had the highest pH after 12-hours without feed access and experienced the greatest drop in pH as feed was consumed during the day when compared with longer feed access time treatments. There was a treatment by hour interaction (P < 0.01) for mean ruminal pH. In hours 0-1 and 17-23 relative to feeding mean ruminal pH was greater for heifers given 12 hours of feed access compared to 24 (Figure 1). While the mean pH was lower between 24 and 12 hours of feed access, the minimum pH was the same as both treatments reached a minimum pH of 5.55-5.56. There were no hourly differences for cattle given 15 or 18 hours of feed access (Figure 2).
Treatments2 | Orthogonal contrast P-value | ||||||||
Item | 12 | 15 | 18 | 21 | 24 | SEM | Linear | Quadratic | Cubic |
| Ruminal pH3 | |||||||||
| Mean pH | 6.11 | 5.81 | 5.81 | 6.05 | 5.92 | 0.081 | 0.65 | 0.12 | 0.05 |
| Min pH | 5.56 | 5.38 | 5.34 | 5.58 | 5.55 | 0.068 | 0.46 | 0.07 | 0.13 |
| Max pH | 6.65 | 6.36 | 6.33 | 6.55 | 6.34 | 0.086 | 0.18 | 0.28 | 0.05 |
| pH Magnitude4 | 1.09 | 0.98 | 0.99 | 0.97 | 0.79 | 0.060 | <0.01 | 0.47 | 0.17 |
| pH Variance | 0.030 | 0.101 | 0.086 | 0.040 | 0.038 | - | - | - | - |
| pH CV5,% | 2.71 | 5.14 | 5.01 | 3.11 | 3.07 | 0.922 | 0.65 | 0.07 | 0.15 |
| 1pH data collected from a 16 head subsample of the main population within the same pen and data reported was collected during a 77-day period that the heifers were fed the finishing diet. 2Treatments are listed in hours of access to feed. All heifers were allowed access to the feed bunks at 0830 each day and were mechanically locked out from feed after the designated treatment access time. 3Ruminal pH measurements were recorded every 10 minutes by Moonsyst pH probes. Min, Max, and Variance values are the variable's respective mean values taken from 24-hour periods across days. 4pH Magnitude = Max pH – Min pH for each animal. 5Coefficient of Variation (CV) = standard deviation / mean (Individual heifer across days). | |||||||||
Conclusion
As access time to feed was increased from 12 to 24 hours, feed intake increased linearly, with feed access time of 15 hours or more per day having about 5% greater intakes than the 12-hour treatment. Heifers given 12 hours of feed access time had an observable numerical decrease in ADG and HCW when compared to other access time treatments, however there were no statistical differences in gain or feed conversion. As access time to feed was increased, cattle spent more time at the feed bunk, ate at a slower rate, and exhibited more variation in feed intake across days. In the rumen of cattle with less access time to feed, the pH over a 24-hour period dropped during feeding and recovered following the beginning of restriction by a greater magnitude. Cattle feeding behavior is adaptable to feedlot systems of different bunk management strategies, at least in this study in the winter. Clean bunk systems with access times greater than or equal to 15 hours may aid in controlling feed intake variation over an ad-libitum bunk system, without sacrificing losses in gain or dry matter intake, however an improvement in feed conversion should not be expected.
Acknowledgment
Implants provided by Merck Animal Health. Rumensin and Tylan provided by Elanco Animal Health.
Copyright © 2025 The Board of Regents of the University of Nebraska. All rights reserved.