Authors: Thomas Aquino, Graduate Student; Mary Drewnoski, Professor; Biquan Zhao, Postdoctoral Research Associate; Pedro Fernandes, Research Technician; Isaque Vicci, Research Technician, Lincoln; Mitch Stephenson, Associate Professor, PHREEC, Scottsbluff; Yijie Xiong, Assistant Professor, Animal Science, Lincoln.
Summary with Implications
While virtual fencing (VF) has proven effective in managing cattle, limited data exist on using it to manage two separate groups of cattle within the same area. If successful, this approach could reduce infrastructure costs and increase management flexibility. In this trial, VF-trained steers (n = 39) were placed in pastures with either no neighboring cattle (isolated) or next to a separate group with only a VF boundary between them (co-fenced). Containment exceeded 99% across all cattle, demonstrating that VF creates effective boundaries regardless of fence treatment. There was no statistical difference in the number of audio or electric pulse cues, meaning cattle did not interact with the VF boundary differently between treatments. These results suggest VF can maintain separate groups of cattle within shared pastures, offering a tool for more precise pasture management. This could enable producers to allocate forage, manage animal classes, or implement more intensive grazing strategies without the labor, time, and infrastructure cost of building physical fences.
Introduction
Traditionally, grazing management is limited to producers’ willingness to build and maintain permanent wire or temporary electric fences. As the intensity of grazing management increases, so does the amount of labor and maintenance associated with the fences. For instance, in a leader-follower grazing system, animals with different nutrient requirements are allowed to selectively graze in an area, and then are followed by another group with lower nutrient requirements to graze the same area. The ability to graze these groups separately in the same area requires large amounts of management, labor, and fences. Virtual fences (VF) could provide producers with an opportunity to more precisely manage the areas that animals graze based on their nutritional requirements. In a VF system, cattle are fitted with GPS equipped neckbands or collars and are kept within producer determined boundaries through the use of audio and electric (pulse) stimuli. There is extensive data to support the use of VF in managing cattle in both extensive range settings and smaller but more intensive grazing systems. One commonality among previous research is that the VF was used to manage a single group of cattle in a virtual paddock. However, there is little data exploring the use of VF to manage multiple groups of cattle within the same pasture separated only by a VF boundary. The ability to manage multiple groups in the same area with VF would allow producers to manage individual groups without the need to build and maintain additional physical cross fences to keep cattle separated.
Procedure
This trial was conducted at the University of Nebraska-Lincoln Eastern Nebraska Research, Extension, and Education Center (ENREEC) near Mead, Nebraska, during the summer of 2024. The pastures grazed consisted of primarily smooth bromegrass (Bromus inermis).
Virtual Fence System and Fence Treatments
Experimental herds grazed in one of two different fence treatments during this trial. Co-fence steers were grazed in a paddock with another non-experimental group in an adjoining paddock. These paddocks were separated via VF without a physical boundary constructed between them. The second fence treatment was “isolated”, in which steers were grazing in a paddock with no other groups of cattle around them. Fences were created and managed using EShepherd virtual fence neckbands (ES1, Gallagher Animal Management, Kansas City, MO). With ES1 neckbands, when cattle approach the VF boundary (within 16 ft), the neckband plays a 5 second audible warning (audio cue) with a rising pitch followed by a 1 second electrical pulse (pulse). If at any time during this sequence the animal reacted and turned away from the virtual boundary, the stimuli would stop. If the animals failed to turn around and continued towards the virtual boundary, this sequence of stimuli would repeat an additional two times resulting in a total of three sequences. After the third sequence, the VF system considered the animal escaped and would not continue the audio or pulse stimuli. When escaped, animals do not receive any stimuli when returning to the designated VF area. After the animal returned to the virtual paddock at a later time, the system would resume normal sequence of stimuli if the animal approached the virtual boundary again.
Training Procedure
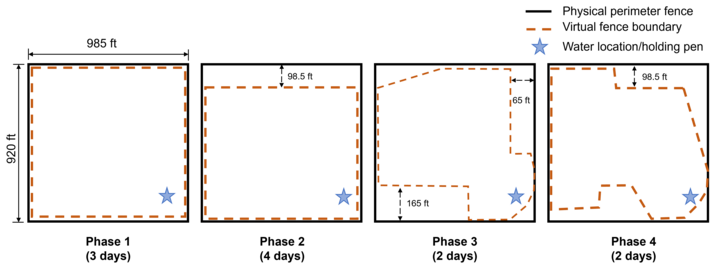
Initially, 45 steers (754 ± 38 lbs) were trained together to the VF system. The training procedure is used to “teach” animals to associate the audio cues with the virtual boundaries. It is critical that cattle are “well-trained” to ensure successful deployment of any VF system. For this study, the training procedure utilized a 14-acre pasture (separate from the experimental pastures) with physical perimeter fences. Initially, steers were fitted with neckbands and were allowed to acclimate to the pasture and neckbands for 2 days before any VF feature was activated and training began. Figure 1 illustrates the layout of the VF within the training paddock and the duration of each training phase. The goal of the training procedure is to have the animals’ associate the sound/pulse cue with existing parameter fences, then encourage animals to interact with the VF stimuli by moving the VF boundary periodically, such that they begin to associate the sound cue with the pulse.
In order to estimate an individual’s response to VF stimuli, an audio to electric pulse ratio (audio ratio) was calculated as an estimate of animal responsiveness to the cues delivered by the collars. Audio ratio can be expressed as Number of Audio Cues ÷ (Number of Audio + Pulse Cues) × 100, with the target audio ratio for trained animals being greater than 80%. The audio ratio was calculated for the entire training period. As the audio ratio increases, it is assumed that the animals are responding to the audio cues with less to no need to receive a pulse.
Upon completion of the training period, animals were stratified by audio ratio. It is important to note that 45 steers were VF trained and only 39 steers were used for the trial. The animals with the lowest audio ratio (i.e., least responsive to audio cues), were removed (n = 3). Additionally, one animal was removed for disposition, and two animals were removed due to unrelated health reasons. The remaining animals (n = 39) were stratified by audio ratio (81 ± 6%) and assigned randomly into one of 3 herds, with 13 steers per herd.
Experimental Units and Pastures
Two experimental groups of steers (group A and group B) were randomly assigned to be on trial, representing experimental units (EU). The third group (group X) was assigned to graze in the adjoining virtual paddock for the co-fence treatment. Location and boundary interaction data from this non-experimental group was collected via VF neckbands but did not undergo statistical analysis.
Two 30-acre pastures were subdivided into three equal (by area) virtual fence paddocks, approximately 10 acres each (Figure 2). Two of the adjacent paddocks in each pasture (paddocks 1 and 2) were assigned to the co-fence treatment. In the co-fence treatment, an experimental group of steers grazed in one VP while the non-experimental group grazed in the adjoining VP. These co-fenced paddocks were separated by a buffer zone of approximately 80 ft between the adjoining VF boundaries. The third paddock (paddock 3) was used for the isolated treatment where an experimental group of steers grazed with no other groups of cattle around. Throughout the trial, water sources were placed in areas away from the adjacent virtual boundary to ensure cattle had free choice access to water without accidentally interacting with any VF.

Data Collection Periods
The data collection period was divided into eight 7-day periods (weeks 1 through 8). During each week, the experimental groups were housed in either the co-fenced or isolated paddocks within each pasture. A schedule of treatments was created to determine which treatment/pasture combination groups would be in each week (Table 1). Fence treatments (co-fenced or isolated) were randomly assigned to pasture, then the groups were assigned to the treatments. Based on the location of the pastures, steers were loaded onto trailers and hauled to their respective paddocks. At the conclusion of each week, VF were deactivated, steers were gathered on horseback and then loaded and hauled to their next VF paddock. Once they arrived, steers were held in a small physical pen until the VF were activated for all animals, then they were turned out into their VF paddock. At the conclusion of the final week of data collection, the collars were deactivated and cattle were restrained in a chute while animal care technicians removed the VF neckbands.
Week | ||||||||||
Pasture | Treatment | Paddock | 1 | 2 | 3 | 4 | 5 | 6 | 7 | 8 |
1 | Co-fenced | 1 | - | X | - | - | B | A | - | X |
|
| 2 | - | B | - | - | X | X | - | A |
| Isolated | 3 | B | - | A | B | - | - | A | - |
2 | Co-fenced | 1 | A | - | X | X | - | - | B | - |
|
| 2 | X | - | B | A | - | - | X | - |
| Isolated | 3 | - | A | - | - | A | B | - | B |
Data Analysis
Neckbands recorded global positioning system (GPS) coordinates approximately every 10 min as well as the number of audio and pulse cues that occurred within that 10-min period. Each week, data were retrieved from the online data server and were sorted into the correct EU and the total number of audio and pulse cues were calculated.
Containment rate can be used to estimate the efficacy of the VF system at keeping cattle contained within the virtual boundary. Steers with GPS coordinates within the VF boundary were denoted as contained, while points outside of the boundary area were considered escaped. Based on the GPS data for each EU each week, containment rate is expressed as the percentage of GPS points that were within the VF paddock.
Based on the non-normal distribution of the interaction data (audio, pulse, and audio ratio), transformation was required prior to statistical analysis. In this report, the raw means are reported, as these are the actual average of interactions experienced per steer per day. For each respective variable, several transformation methods were tested, with the most effective being selected for each individual variable. Transformed data were analyzed using the GLIMMIX procedure of SAS 9.4. The model used for the audio, pulse, and audio ratio data included fixed effect of fence treatment and random effects of week and day (week). For containment rate, percentages were expressed as proportions (between 0 and 1) in order to fit the assumptions required for a beta distribution. Values of 1 (100% containment) were changed to 0.999. The statistical model included the fixed effects of fence treatment and random effects of herd, pasture, and week. Any P-values ≤ 0.05 were considered significant.
Results
Containment Rate
Calculated on a per treatment per week basis, containment rate is expressed as the percentage of GPS points within the VF boundary. There was no difference (P = 0.10) in containment rate between the 2 fencing treatments with both groups having exceptionally high containment rates that were over 99%. Specifically, the co-fence containment rate was 99.96 ± 0.032% and isolated was 99.68 ± 0.178%. While the containment rate was consistently above 99.5%, there was one instance during week 2 that one individual steer, from the non-experimental group, escaped from the VP and did not return to his designated paddock, instead staying with the experimental group. This steer was sorted back into his correct group at the conclusion of week 2.
Virtual Fence Interactions
All interactions are reported as the average number of cues received per steer per day. There was no difference (P = 0.92) in the number of audio cues, or the number of pulse cues (P = 0.34) across fence treatments (Table 2). On average, the steers received approximately 15 audio cues per day and less than one pulse per day. When evaluating audio ratio over the entire trial period, there was no difference (P = 0.94) across treatments, with the average audio ratio being 95.7%. This means that the steers received about 1 pulse cue for every 20 audio cues over the course of the trial, indicating that the steers learned to associate the audio cues with the VF boundary, without the need for receiving a pulse cue.
| Fence treatment (mean ± SEM) |
| |
| Co-fenced | Isolated | P-value |
Audio Cues a | 15.0 ± 2.81 | 15.2 ± 2.59 | 0.92 |
Pulse Cues a | 0.57 ± 0.08 | 0.73 ± 0.19 | 0.34 |
Audio Ratio % b | 95.7 ± 0.01 | 95.7 ± 0.01 | 0.94 |
Containment Rate % b | 99.96 ± 0.032 | 99.68 ± 0.178 | 0.1 |
| a Values represent number of audio and pulse cues per steer per day b Values represent audio ratio and containment rate averaged across experimental units by week. | |||
Conclusions
Virtual fence can create very effective boundaries regardless of fence treatment. Again, it is critical to ensure animals are properly trained to the VF system. Once trained, animals learn to respond primarily to the audio cues. In a traditionally fenced system, the labor and fencing demands of intensive grazing methods, such as a leader follower system, often deter producers from using them. Based on the results of the present trial, grazing two individual groups within the same area, without the need for physical cross fences, may be possible with VF. For producers who are concerned about the labor and fence demands of a leader follower, or other intensive grazing management system, using VF may present a viable option.
Acknowledgment
This project is supported by the United States Department of Agriculture grant 58-3040-1-013: Precision Livestock Management Systems for Western Rangelands.
Copyright © 2025 The Board of Regents of the University of Nebraska. All rights reserved.