Many producers are contemplating heifer retention amid record feeder calf prices. Under current market conditions, driven by short supply of replacement females, balancing future production with high replacement costs is a challenge.
The Beef Cow Replacement Value Forecast from the University of Nebraska is released annually to aid producers in evaluating whether to buy, sell or trade replacement cows.
The forecasts incorporate a full range of factors, including current and future costs, productivity, and revenue projections for cows, calves and related items for the next ten years.
This forecast is designated for producers to use as a guide, and recognizes individuals have unique circumstances and expectations that should be used to adjust values accordingly.
Overview
Selecting replacement heifers/cows differs from ranch to ranch, but value for both retained and purchased animals generally depends on:
- Longevity - the replacements ability to stay in the herd as a productive unit.
- Productivity - both current and future expected difference between costs and revenues (calf price and production costs differences over the heifer’s productive life)
- Genetic and phenotypical compatibility with herd mates (the animal conforms with the production system and performance goals of the ranch)
- Operator goals and management style (heifer’s contribution to future of the ranch)
- Financial standing, specifically debt related to cow purchases
To develop forecasts producers should know the following about their operation:
- Annual cost of production per cow. The authors used UNL’s Cow Cost Cow-Q-Lator combined with producer production information and the agricultural economics depart annual real estate survey data. As mentioned, three levels of production costs were estimated, Low (Lo), Medium (Med) and High (Hi). The magnitude of these values are listed on the next page.
- Analysis does not include calving rate, replacement cost/depreciation expense, or death loss.
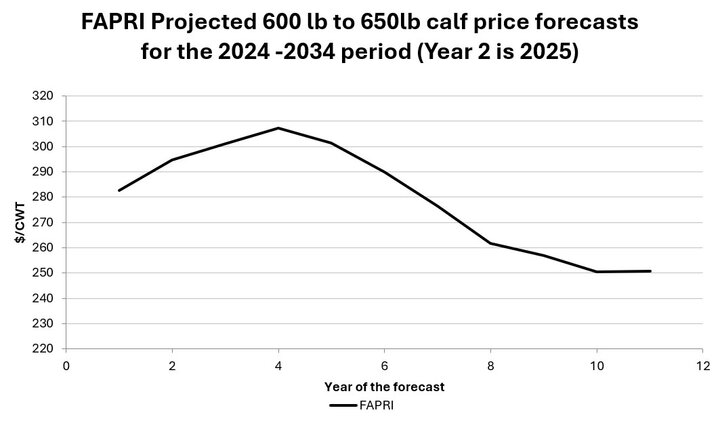
- Values and costs are adjusted annually for 10 years within the simulated forecast period derived from the FAPRI report. University of Missouri Food and Agriculture Policy Research Institute (FAPRI) as the current 10-year projections.
- Three average levels of cow replacement rates (see Figure 1). This is measured as a percentage of the total number of cows in the herd. This value is constant each year and keeps the herd at a constant size. This number represents the percentage of replaced, culled, or dead cows and is a practical and tractable measure of average cow longevity.
- The average cost for a replacement heifer/cow is set at $2500
- The average calving rate ranged between 88% to 98% with 93% chosen to represent industry average.
2025 Annual Production Costs
- Nebraska’s USDA statistical “North” region’s average estimated annual production costs per cow estimated using the Cow Cost Cow-q-lator (CCCQL):
- Low (LO) cost producer: $1,033.81/cow
- Medium (MD) cost producer: $1,266.28/cow
- High (HI) cost producer: $1,422.92/cow
- The UNL Ag Econ Real Estate Report, 2025 for pasture rental cost for the North statistical region is:
- Bottom one third of rental costs: $65.35/pair/month
- Average rental costs: $77.90/pair/month
- Top one third of rental costs: $88.60/pair/month
- Winter rates are calculated as one half of the summer rates.
- Cost Distribution
- Pasture and hay account for 33.5–40.0% of all costs and 74.8%–76.2% of total feed costs.
- Total feed costs make up 45.6–53.5% of all costs.
Figure 1. The three levels of cow replacement
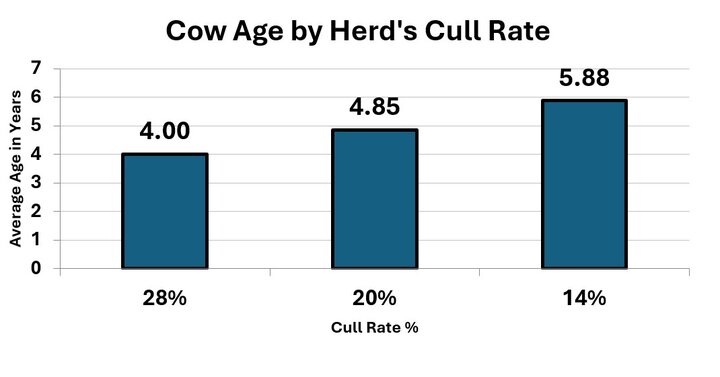
Figure 2. FAPRI calf price projections
Breakeven Value Forecasts
Figure 3. Replacement heifer breakeven value forecasted average cost and replacement rates.

The nine breakeven forecasts are derived from 1,000 simulations for each sub-scenario, which consist of three replacement rates and three levels of production costs.
Replacement Rates: 14%, 20%, and 28%.
Production Costs: Lo, Med, and Hi levels.
Table 1. Breakeven values of beef cow replacements based on annual production cost and replacement rate. Baseline – Part A | |||||||
| Cost Level | 14% | 15% | 16% | 17% | 18% | 19% | 20% |
$1,034 | $3,739 | $3,670 | $3,602 | $3,533 | $3,465 | $3,396 | $3,328 |
$1,049 | $3,665 | $3,599 | $3,533 | $3,466 | $3,400 | $3,334 | $3,267 |
$1,065 | $3,592 | $3,528 | $3,464 | $3,400 | $3,335 | $3,271 | $3,207 |
$1,080 | $3,518 | $3,457 | $3,395 | $3,333 | $3,271 | $3,209 | $3,147 |
$1,096 | $3,445 | $3,385 | $3,326 | $3,266 | $3,206 | $3,146 | $3,087 |
$1,111 | $3,371 | $3,314 | $3,256 | $3,199 | $3,141 | $3,084 | $3,026 |
$1,127 | $3,298 | $3,243 | $3,187 | $3,132 | $3,077 | $3,022 | $2,966 |
$1,142 | $3,224 | $3,171 | $3,118 | $3,065 | $3,012 | $2,959 | $2,906 |
$1,158 | $3,151 | $3,100 | $3,049 | $2,998 | $2,948 | $2,897 | $2,846 |
$1,173 | $3,077 | $3,029 | $2,980 | $2,932 | $2,883 | $2,834 | $2,786 |
$1,189 | $3,004 | $2,958 | $2,911 | $2,865 | $2,818 | $2,772 | $2,725 |
$1,204 | $2,930 | $2,886 | $2,842 | $2,798 | $2,754 | $2,709 | $2,665 |
$1,220 | $2,857 | $2,815 | $2,773 | $2,731 | $2,689 | $2,647 | $2,605 |
$1,235 | $2,783 | $2,744 | $2,704 | $2,664 | $2,624 | $2,584 | $2,545 |
$1,251 | $2,710 | $2,672 | $2,635 | $2,597 | $2,560 | $2,522 | $2,484 |
$1,266 | $2,636 | $2,601 | $2,566 | $2,530 | $2,495 | $2,460 | $2,424 |
$1,277 | $2,583 | $2,549 | $2,516 | $2,483 | $2,450 | $2,416 | $2,383 |
$1,287 | $2,529 | $2,498 | $2,467 | $2,435 | $2,404 | $2,373 | $2,342 |
$1,298 | $2,475 | $2,446 | $2,417 | $2,388 | $2,359 | $2,330 | $2,301 |
$1,308 | $2,421 | $2,394 | $2,368 | $2,341 | $2,314 | $2,287 | $2,260 |
$1,318 | $2,367 | $2,343 | $2,318 | $2,293 | $2,268 | $2,244 | $2,219 |
$1,329 | $2,314 | $2,291 | $2,268 | $2,246 | $2,223 | $2,201 | $2,178 |
$1,339 | $2,260 | $2,239 | $2,219 | $2,198 | $2,178 | $2,157 | $2,137 |
$1,350 | $2,206 | $2,188 | $2,169 | $2,151 | $2,133 | $2,114 | $2,096 |
$1,360 | $2,152 | $2,136 | $2,120 | $2,104 | $2,087 | $2,071 | $2,055 |
$1,371 | $2,098 | $2,084 | $2,070 | $2,056 | $2,042 | $2,028 | $2,014 |
$1,381 | $2,045 | $2,033 | $2,021 | $2,009 | $1,997 | $1,985 | $1,973 |
$1,392 | $1,991 | $1,981 | $1,971 | $1,961 | $1,951 | $1,942 | $1,932 |
$1,402 | $1,937 | $1,929 | $1,922 | $1,914 | $1,906 | $1,898 | $1,891 |
$1,412 | $1,883 | $1,878 | $1,872 | $1,866 | $1,861 | $1,855 | $1,850 |
$1,423 | $1,829 | $1,826 | $1,822 | $1,819 | $1,816 | $1,812 | $1,809 |
Table 1. Breakeven values of beef cow replacements based on annual production cost and replacement rate.
| Baseline – Part B | ||||||||
| Cost Level | 21% | 22% | 23% | 24% | 25% | 26% | 27% | 28% |
$1,034 | $3,269 | $3,211 | $3,152 | $3,093 | $3,035 | $2,976 | $2,918 | $2,859 |
$1,049 | $3,211 | $3,154 | $3,097 | $3,041 | $2,984 | $2,927 | $2,871 | $2,814 |
$1,065 | $3,152 | $3,097 | $3,043 | $2,988 | $2,933 | $2,878 | $2,823 | $2,768 |
$1,080 | $3,094 | $3,041 | $2,988 | $2,935 | $2,882 | $2,829 | $2,776 | $2,723 |
$1,096 | $3,036 | $2,984 | $2,933 | $2,882 | $2,831 | $2,780 | $2,729 | $2,678 |
$1,111 | $2,977 | $2,928 | $2,879 | $2,829 | $2,780 | $2,731 | $2,681 | $2,632 |
$1,127 | $2,919 | $2,871 | $2,824 | $2,777 | $2,729 | $2,682 | $2,634 | $2,587 |
$1,142 | $2,860 | $2,815 | $2,769 | $2,724 | $2,678 | $2,633 | $2,587 | $2,541 |
$1,158 | $2,802 | $2,758 | $2,715 | $2,671 | $2,627 | $2,583 | $2,540 | $2,496 |
$1,173 | $2,744 | $2,702 | $2,660 | $2,618 | $2,576 | $2,534 | $2,492 | $2,451 |
$1,189 | $2,685 | $2,645 | $2,605 | $2,565 | $2,525 | $2,485 | $2,445 | $2,405 |
$1,204 | $2,627 | $2,589 | $2,551 | $2,512 | $2,474 | $2,436 | $2,398 | $2,360 |
$1,220 | $2,569 | $2,532 | $2,496 | $2,460 | $2,423 | $2,387 | $2,351 | $2,314 |
$1,235 | $2,510 | $2,476 | $2,441 | $2,407 | $2,372 | $2,338 | $2,303 | $2,269 |
$1,251 | $2,452 | $2,419 | $2,387 | $2,354 | $2,321 | $2,289 | $2,256 | $2,223 |
$1,266 | $2,393 | $2,363 | $2,332 | $2,301 | $2,270 | $2,240 | $2,209 | $2,178 |
$1,277 | $2,353 | $2,324 | $2,294 | $2,264 | $2,234 | $2,204 | $2,175 | $2,145 |
$1,287 | $2,313 | $2,285 | $2,256 | $2,227 | $2,198 | $2,169 | $2,141 | $2,112 |
$1,298 | $2,273 | $2,245 | $2,218 | $2,190 | $2,162 | $2,134 | $2,106 | $2,079 |
$1,308 | $2,233 | $2,206 | $2,180 | $2,153 | $2,126 | $2,099 | $2,072 | $2,045 |
$1,318 | $2,193 | $2,167 | $2,141 | $2,116 | $2,090 | $2,064 | $2,038 | $2,012 |
$1,329 | $2,153 | $2,128 | $2,103 | $2,079 | $2,054 | $2,029 | $2,004 | $1,979 |
$1,339 | $2,113 | $2,089 | $2,065 | $2,041 | $2,018 | $1,994 | $1,970 | $1,946 |
$1,350 | $2,073 | $2,050 | $2,027 | $2,004 | $1,981 | $1,959 | $1,936 | $1,913 |
$1,360 | $2,033 | $2,011 | $1,989 | $1,967 | $1,945 | $1,923 | $1,901 | $1,880 |
$1,371 | $1,993 | $1,972 | $1,951 | $1,930 | $1,909 | $1,888 | $1,867 | $1,846 |
$1,381 | $1,953 | $1,933 | $1,913 | $1,893 | $1,873 | $1,853 | $1,833 | $1,813 |
$1,392 | $1,913 | $1,894 | $1,875 | $1,856 | $1,837 | $1,818 | $1,799 | $1,780 |
$1,402 | $1,873 | $1,855 | $1,837 | $1,819 | $1,801 | $1,783 | $1,765 | $1,747 |
$1,412 | $1,833 | $1,816 | $1,799 | $1,782 | $1,765 | $1,748 | $1,731 | $1,714 |
$1,423 | $1,793 | $1,777 | $1,761 | $1,745 | $1,729 | $1,713 | $1,697 | $1,681 |
Breakeven Value (BV) Considerations for Producers
- Revenue Variability:
- Fluctuations in calf prices directly impact BVs.
- Higher calf prices → higher BVs; lower prices → lower BVs.
- FAPRI forecasts indicate peak calf prices in 2026, with declining prices henceforth.
- Flexibility in herd management and marketing strategies is crucial to capitalize on favorable market conditions and offset unfavorable ones.
- Profit = Revenue - Expense
- Higher annual production costs relative to revenue diminish profitability, reducing available capital to invest in replacements. Thereby, as annual costs increase, BV tends to decrease.
- Combining low production costs with low replacement rates yielded greater replacement BV.
- Evaluate Costs Accurately:
- Know the true costs of raising replacement versus purchasing them. When comparing raised vs. purchased heifers, price inputs (feed, labor, interest, etc.) for raising replacements at fair-market-value for accuracy.
- Match Simulations to Reality:
- The closer an operation's actual productivity and costs align with the simulation assumptions used here and the expected revenue over each cow’s life span the more accurate the BVs become.
- Focus on Longevity:
- In general, replacement rate is inversely related to BV. Thus, as replacement rates increase, BV decreases and vice versa.
- 14% replacement rate operations extend cows’ productive years, decreasing annual replacement/cow depreciation costs.
- 28% replacement rate operations have greater annual replacement costs, risking lower profit potential of replacements.
Payback Probability Analysis
Table 2. Probability of paying back simulated $4,000/hd. replacement heifer purchase price under each of the nine sub-scenarios.
| Probability of paying off the average cost of $4,000/hd cost for replacement heifer/cow bought in Dec 2025 for the 2025-2026 season | ||||
Cost type $/hd | Lo-Cost $1,033.81 | Med-Cost $1,266.28 | Hi-Cost $1,422.92 | |
| 28% Cull Rate | Hi | 0.0% (#1) | 0.0% (#2) | 0.0 % (#3) |
| 20% Cull Rate | Med | 34.7% (#4) | 0.1% (#5) | 0.0% (#6) |
| 14% Cull Rate | Lo | 52.30% (#7) | 0.3% (#8) | 0.0% (#9) |
# = scenario number
Table 3. A listing of the probabilities of paying back the cow costs for each of the nine scenarios when cows are purchased for $3,500/hd, $3,000/hd and $2,500/hd.
#- Scenario number. Probabilities in descending order of costs, $3,500, $3,000 and $2,500 per head respectively. | |||||||||||||||||||||||||
Key Takeaways
- Probability of Payback for $4,000 Replacements (Table 2):
- Lo-cost operations were the only cost level to have >1% probability for a $4000 replacement to pay back. Even in Lo-Cost, a 14% cull rate with a 52.3% success rate of paying off the $4,000/hd has a BV of $3,700/hd. With 52.3% of the replacement cows returning $4,000 or more, there is an average loss of about $300/hd.
- For scenario 3 (28% cull rate/Hi-Cost), the expected probability of a heifer paying back the $4,000 purchase price is 0.00%.
- Breakeven Value (BV) as a Benchmark:
- Again, considering scenario 3, if the purchase price is lowered from the baseline $4,000/hd to its simulated BV level of $1,680.53/head, the probability of purchased cows paying their way rises to 45.9%.
- Although 55.1% of cows fall short of breaking even, the profitability from the 45.9% with BV equal to or exceeding the $1,680.53 offset those that result in a loss.
- Trends in Replacement Costs Relative to Salvage Value:
- Historically, from 2008 to 2012 the replacement cow costs are estimated to average about 1.69 times that of their salvage value (cull cow value).
- Between 2013 and 2022, this ratio increases to 2.10, reflecting rising replacement costs relative to salvage value.
- For 2024, this ratio climbed further to 2.62, resulting in a wider gap between replacement and cull values.
- Using $4,000/hd replacement value, FAPRI utility cow price of $133.17/cwt, and 1250-pound cow weight, this ratio is estimated to be near 2.40. This slightly lower than 2024 but significantly higher than the historical values and could reflect a structural shift in the industry.
- Impact of Buying cows at various prices:
- Substituting the current $4,000 replacement cost with three lower costs of $3,500hd, $3,000/hd and $2,500/hd leads to expected increases in payback probability (Table 3).
- High replacement costs amplify the risk of being unprofitable. It is important to balance risk of buying expensive cows with the expected future market changes. A sustained high market value justifies paying higher replacement costs, while a market with sharp declines has the opposite effect.
Implications:
- Profitability Requires Balance:
- Producers should carefully consider the relationship between replacement costs and expected revenue over a cow’s productive life to make their best cow replacement decisions.
- Overpaying for high-quality cows or underpaying for low-quality cows could lead to greater financial risk.
- Cow Quality is Key:
- Selecting cows with higher potential productivity and longevity at the “right” price is critical to offset high initial costs.
- Long-Term Considerations:
- Focus on cows that align with the operation's management style to optimize longevity and reasonable prices with respect to the expected market conditions to maximize the probability of a positive BV and profit.
- Market and Cost Sensitivity:
- Producers should consider monitoring market trends as closely as they might monitor cows during the calving season. What is the replacement-to-salvage ratio? What are their production costs? These trends are helpful in making replacement decisions to avoid overextending financial resources.
Summary
- Cow Longevity: ↑ replacement rate → ↓ BV
- Annual Costs: ↑ annual cow cost → ↓ BV
- Adapt to Market Trends: Be prepared for markets to change direction. Stay informed about replacement costs relative to salvage values and calf prices.
- Strategize Replacement Purchases/Retentions: Avoid overly expensive or over-retaining replacements, especially in near market peaks.
- Analyze purchased vs. raised replacements: Assign fair-market value to development costs for raised replacements to compare against purchasing.
- Mitigate Risk: By diversifying replacement purchase strategies.
- Balance herd replacement management strategies with revenue expectations.
- Look for opportunities to forward price when conditions provide suitable profit margins.
Presentation by the authors of this report as a webinar hosted by UNL’s Center for Agricultural Profitability (CAP) are available at: Heifer Price Forecast Webinar (approx. 60 minutes).
This analysis is based on FAPRI forecasts and Nebraska cost estimates and while as complete as could be made at the time. Decisions about purchasing replacement heifers should be guided by each producer’s own expectations for prices and costs, the overall financial health of their operation, and a clear understanding of the associated risks.