What is a respectable beef replacement heifer value for the coming 2022 production season?
This is the fifth annual beef cow replacement value forecast for Nebraska. The intention is to provide baseline replacement heifer values to producers and industry stakeholders. Forecasts provided are derived from a set of very complex interrelationships, many of which are themselves forecasts. The information here is intended as a guide, whereby users would be expected to modify, depending on their circumstances and expectations of future production costs and cow and calf values. The forecasted price and cost variations are those specified by the University of Missouri Food and Agriculture Policy Research Institute (FAPRI) 10-year projections. The changes in percent of annual costs given by FAPRI were used to adjust the costs of Nebraska producers.
Selecting replacement heifers differs from ranch to ranch, but value for both retained and purchased replacements generally depends on:
- Longevity - the replacement heifer’s ability to stay in the herd as a productive unit
- Productivity - both current and future expected difference between costs and revenues (calf price and cost differences over the heifer’s productive life)
- Genetic and phenotypical compatibility with herd mates (heifer conforms with the production system and performance goals)
- Operator goals and management style (heifer contribution to future of ranch)
- Financial standing, specifically debt related to cow purchases
This forecast assumes producers know two things about their operation:
- Annual cost of production per cow. Authors used UNL’s Cow Cost Cow-Q-Lator to help calculate the three levels of costs.
- Average historical replacement rate. This is the number of heifers needed each year to replace culled cows or cull rate and is a measure of cow longevity.
The three annual costs of production for 2021 used to start the model do not include calving rate, replacement cost, depreciation expense, or death loss since these are each accounted for within the simulation itself. The 2022 three annual production costs per cow were identified as $735.48/cow (LO), $866.30/cow (AVE), and $990.32/cow (HI). Values were adjusted within the simulation using those derived from FAPRI cost differences. Costs relate directly to the 2021 Nebraska state average low, median, and high pasture rental rates found in UNL Agricultural Economics department’s 2021 Nebraska Ag Real Estate Report. These rates are a low of $41.05/cow-calf pair, high of $61.27/cow-calf pair, and a middle rate of $51.32/cow-calf pair. Winter rates were half of those charged in the summer. The costs of pasture ranged from about 38-43% of all costs and 65-68% of total feed costs, while feed costs ranged from 56% to nearly 60% of all costs.
Since it is difficult to anticipate and quantify all the possible conditions in which replacement cows are purchased, three representative levels of cost of production and three rates of replacement herd types were used to create a total of nine breakeven value forecasts. Breakeven meaning that the average dollar value cost of purchasing cows equaled the dollars returned from that purchase. The nine forecasts are a result of 1,000 randomly drawn outcomes from each simulated scenario. The nine scenarios were the result of the three cost levels described earlier, and at three rates of 14%, 20%, and 28% annual herd replacement. To account for producers who require added working capital, the same nine scenarios are simulated with half the value of cow replacements borrowed at 5% interest. Cow purchase value averages $1,437.50/hd. The breakeven results from the two simulations are reported in Figures 1 and 2.
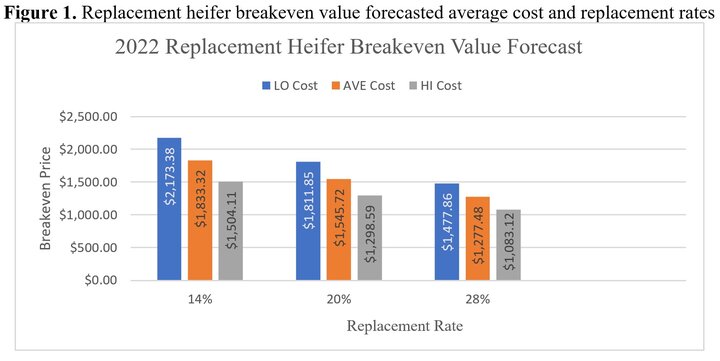
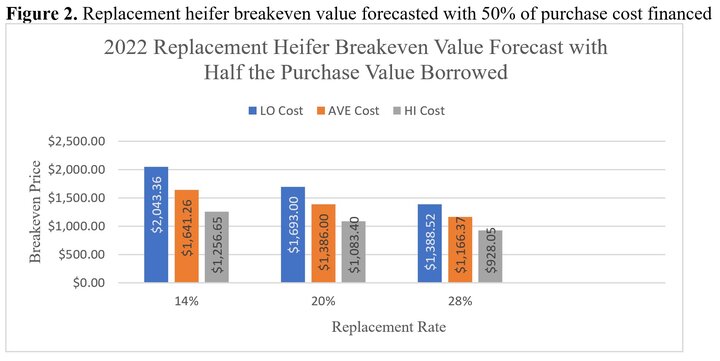
As expected, both costs of production and replacement rates affect how much can be paid for replacement heifers and ability to breakeven. Borrowing money to help pay for replacements also reduces their breakeven value, captured in Table 1. At the highest replacement rate (28%) and lowest annual cost ($735.48/hd), there is $89.34/hd reduction in breakeven, as a result of financing. The largest drop in breakeven value occurs with the lowest replacement rate (14%) and annual production costs of $990.32/hd. That breakeven value resulted in a reduction of $47.46/hd, due to borrowing money. The overall average drop in breakeven value caused by borrowing half the replacement value is 157.65/hd.
Table 1. Captured difference of no-borrowed money (NBM) to borrowed money (BM) on breakeven values
|
Breakeven difference between BM and NBM $/hd |
Annual Replacement Rate |
||
|
Costs/Hd./Year |
14% Replacement Rate |
20% Replacement Rate |
28% Replacement Rate |
|
(LO) $735.48 |
-$130.02 |
-$118.85 |
-$89.34 |
|
(AVE) $866.30 |
-$192.06 |
-$159.72 |
-$111.11 |
|
(HI) $990.32 |
-$247.46 |
-$215.19 |
-$155.07 |
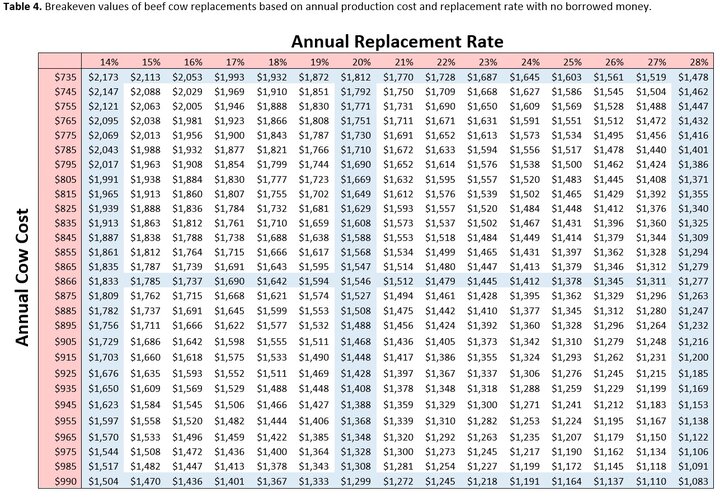
The following two tables are valuable and can be used to extrapolate changes in replacement cow breakeven values based on replacement rate, annual production costs, and/or both. Table 2 lists the decrease in breakeven value for each percent (%) increase in replacement rate by cull rate group. For example, the reduction in breakeven value for NBM with a replacement rate between 14% and 20% in the lowest annual per head cost group decreases by $60.25/hd. Scenarios where no money is borrowed for cow purchases have a slightly greater reduction for each percent in replacement rate increase than those with borrowed money. However, all breakeven values for like scenarios of borrowed money are still less than those that do not borrow money. Finishing with an example, if a producer in the lowest cost category had an 18% replacement rate and a 3% increase, the breakeven would fall by $180.75/hd. From Figure 1, that would mean it would decrease from $2,173.38/hd to $1,992.63/hd.
Table 2. Dollars decreased in cow replacement value for each % increase in replacement rate
|
Changes in breakeven for NBM (no borrowed money) scenarios for cull rate changes |
||
|
Costs |
Replacement Rate Range 14%-20% |
Replacement Rate Range 20%-28% |
|
(LO) $735.48 |
-$60.25 |
-$41.75 |
|
(AVE) $866.30 |
-$47.93 |
-$33.53 |
|
(HI) $990.32 |
-$34.25 |
-$26.93 |
|
|
|
|
|
Changes in breakeven for BM (borrowed money) scenarios for cull rate changes |
||
|
Costs |
Replacement Rate Range 14%-20% |
Replacement Rate Range 20%-28% |
|
(LO) $735.48 |
-$58.39 |
-$38.06 |
|
(AVE) $866.30 |
-$42.54 |
-$27.45 |
|
(HI) $990.32 |
-$28.88 |
-$19.42 |
Table 3 demonstrates that increase in annual production cost also decreases the breakeven value of cow replacements. For every dollar increase in cost, there is more than a dollar’s worth of decline. The 14% replacement rate has the greatest impact on cow replacement value, more so with financed cow purchases. At the 14% replacement rate with the highest annual production costs group, BM and NBM respectively have a $3.10/hd and $2.65/hd decrease in breakeven value for every dollar increase in cost, the most for all scenarios.
Table 3. Dollars decreased in cow replacement value for each $1 increase in costs
|
Changes in breakeven for NBM scenarios for costs changes |
|||
|
Costs/Hd./Year Range |
14% Replacement Rate |
20% Replacement Rate |
28% Replacement Rate |
|
$735.48 to $866.30 |
-$2.60/$1 |
-$2.03/$1 |
-$1.53/$1 |
|
$866.30 to $990.32 |
-$2.65/$1 |
-$1.99/$1 |
-$1.57/$1 |
|
|
|
||
|
Changes in breakeven for BM scenarios for costs changes |
|||
|
Costs/Hd./Year |
14% Replacement Rate |
20% Replacement Rate |
28% Replacement Rate |
|
$735.48 to $866.30 |
-$3.07/$1 |
-$2.35/$1 |
-$1.70/$1 |
|
$866.30 to $990.32 |
-$3.10/$1 |
-$2.44/$1 |
-$1.92/$1 |
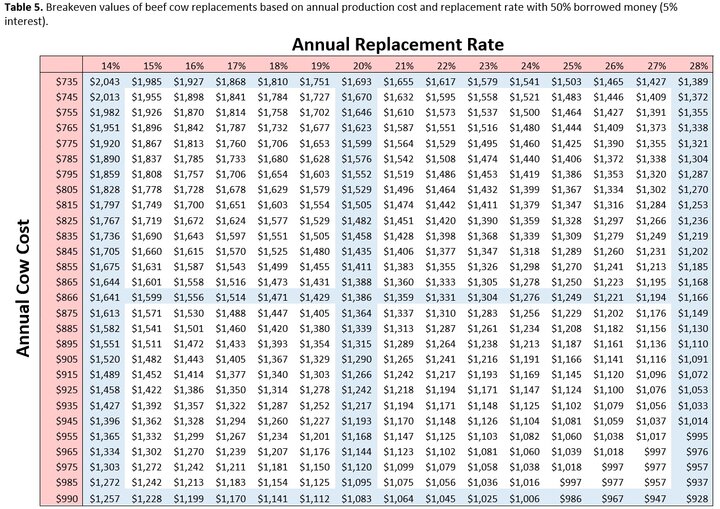
The information found in tables 2 and 3 are used to make forecast breakeven values for each 1% increase in replacement rate and for every $10/hd annual production costs increase. Please see tables 4 and 5 at the end of this document. Table 4 has forecast breakeven values for cow replacements bought without borrowing money (NBM). Table 5 list the breakeven forecast for replacement cows purchased with 50% of their cost being borrowed (BM). To find a forecast simply identify the annual per cow costs of production you wish, these are listed in the far-left column of the tables, then identify the appropriate replacement rate, the top row of each table. Once you have found the desired column and row, find their intersection. This is to the right of the cost and below the replacement rate. For example, using Table 4 let’s consider an annual production cost of $915/hd, and a replacement rate of 17%, their intersection lists a breakeven forecast of $1575/hd. Table 5 for the same production costs and replacement rate has a lower breakeven value of $1377hd, $198/hd less.
Increasing productivity without altering costs would result in greater revenue, which would not be accounted in any of the scenarios. Therefore, the accuracy of the forecast is dependent on how closely an operation’s productivity and revenue match those specified in the model. Productivity changes include calving rates and calf growth rates among others. Revenue changes also play a role in altering breakeven value. Demand and supply shifts that alter cattle price also have an impact on replacement heifer breakeven value. Higher calf prices lead to higher breakeven values, while lower prices lead to lower breakeven values. This last point may seem obvious, but remember it is complicated by a heifer’s productive life that can span more than a decade or less than a complete season. Accurately forecasting these values leads to better forecasting cow replacement values. An economically successful producer, on average, buys or raises replacement heifers for no more than what is needed in net returns over their lifetime. The purchase value of any particular replacement heifer is unknown without knowing her future longevity, productivity, costs, and cattle prices. In other words, the purchase of any single animal has some very real risk associated, nothing new or earth shattering, but worthy of recognition.
A positive outcome in purchasing replacements over time comes down to the animal’s ability to return as much or more value than was paid and this is only accomplished if the operation selects the right type of animals, at the right price and the right time. One can always find the instance where an overpriced replacement broke even or made money, as well as where an inexpensively purchase cow ended with a loss. The important thing is that on average good choices out preform those that didn’t pan out. Remember raising replacements doesn’t make them free, in fact it is important to know what they cost to raise and how they rate in value relative to purchased animals. This however is a topic for another day. As longevity of a replacement cow increase, average herd age increases, and breakeven values increase, except when cost exceeds revenue. Low cost, low replacement herds can afford higher valued replacement heifers and replace capital faster in their operations. When raising or purchasing replacement heifers, each heifer’s value is based on her ability to stay in the herd and the producer’s ability to manage that productivity, control costs, and use the market to their advantage. Applying these principles is key to making an operation more profitable and resilient.
This year’s forecasts are not much different than last year’s report for the nine NBM forecast. Six of these scenarios were higher than last year’s breakeven value, while three were lower. Production costs were higher than last year. Projected future costs are also elevated, but so are future animal values, compensating for the higher costs.
A presentation and discussion of this report will be hosted by UNL’s Center for Ag Profitability February 10 as a webinar, anyone is welcome to join.
Interviews with the authors of BeefWatch newsletter articles become available throughout the month of publication and are accessible at https://go.unl.edu/podcast.
Topics covered:
Budgets & cost of production, Marketing, budgets & management