The Cattle Comfort Index was developed to provide cattle producers and individuals who consult for them with guidance for understanding the thermal environment as experienced by cattle. Heat released from ruminal fermentation results in cattle having comfortable thermal conditions at lower temperatures than for humans. Interpreting CCI values within this context provides humans with a perception of thermal stress that better represents how cattle sense heat.
In a previous Beef Watch article , components of CCI and how to access Nebraska Mesonet (Mesonet) or a CCI forecast tool available at the High Plains Regional Climate Center (https://hprcc.unl.edu/stationtool/explore.php#) were addressed.
Building on the previous article, this article deals with a series of simulations conducted to demonstrate how environmental components (temperature, humidity, wind speed and solar radiation) of CCI interact to change it in a positive or negative direction. A second objective of this article is to demonstrate how a change in one direction by one component of CCI may offset a change in the opposite direction by another component of CCI.
Understanding how CCI factors result in changes in CCI
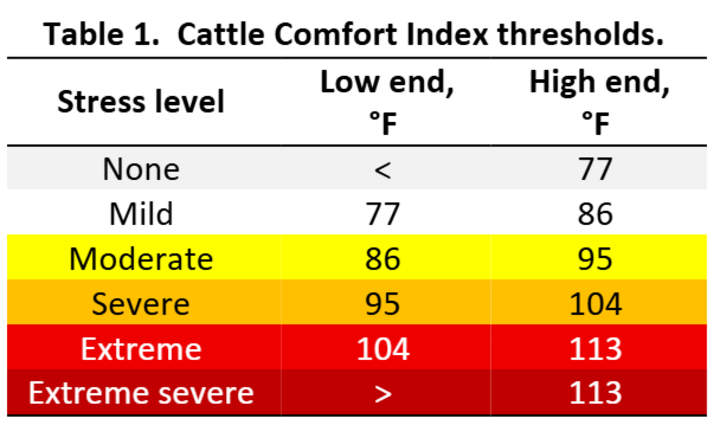
For reference, Table 1 of the Beef Watch article entitled Getting reacquainted with the Cattle Comfort Index (CCI) is reproduced here. This table, derived from the original publication by Dr. Terry Mader and his collaborators, demonstrates, using ranges in CCI values, thresholds by which cattle comfort varies.
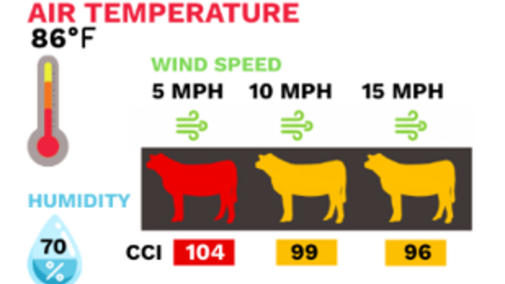
Simulating an event at 86° F in which there is no solar radiation protection or cloud cover and wind speed varies from 5 to 15 mph with relative humidity ranging from 30 to 70% results in a range of CCI from 89 to 104 (Figure 1; left panel). Referring to Table 1 above, a CCI of 89 reflects mild heat stress while a CCI of 104 is indicative of extreme heat stress.
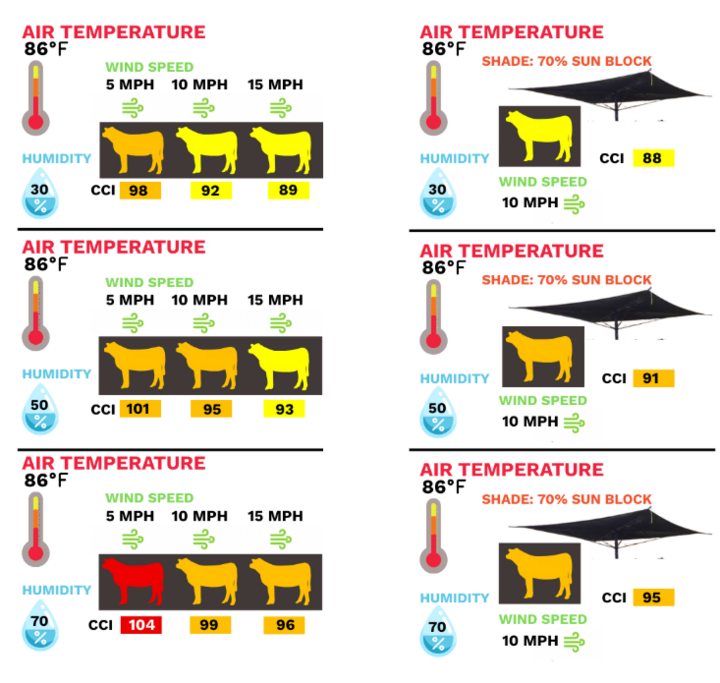
The results of this simulation demonstrate the negative effect of high humidity at the same temperature. From Table 1 and Figure 1 (left panel, top to bottom), keeping wind speed and temperature at 5 mph and 86° F, respectively, demonstrated an increase in CCI from 98 to 101 to 104 corresponding to relative humidity at 30%, 50% or 70%, respectively.
Similarly, from this simulation, the effects of wind speed are noted in Figure 1. Simulated increases in wind speed reduced the value of CCI from 98 to 89, from 101 to 93, or from 104 to 96 for relative humidity set at 30%, 50% or 70%, respectively (left panel within each relative humidity set from left to right).
Lastly, this exercise demonstrates the positive effect of access to shade at 86° F with wind speed fixed at 10 mph and humidity ranging from 30% to 70% in Figure 1 (right panel, top to bottom). Blocking 70% of solar radiation (common when using commercial shade structures) reduced CCI by 4 units.
CCI component tradeoffs
Summers in the high plains are warm and humid, with daytime solar radiation generally constant; therefore, wind speed represents the single factor that might make a difference in hot and humid days. Given these conditions, and the fact that most folks rely on weather apps on their cellular devices to plan their day, understanding the relationships between CCI components may serve as an early prompt to review the CCI forecast.
Two series of simulations (one at full solar radiation and one with 70% solar radiation block) to determine CCI under various conditions were undertaken. Simulations were generated with temperatures ranging from 76° F to 100° F while wind speed and relative humidity were permitted to vary from 5 to 15 mph or 30% to 85%, respectively.
Under full solar radiation the following equivalencies were determined. At the same relative humidity, CCI values were equivalent when a change in temperature of 1° F was offset by a change in wind speed of 2.5 mph. Similarly, holding temperature constant, a change in wind speed of 5 mph was required to offset a change in relative humidity of 15 percentage units. Lastly, holding wind speed constant, a change in relative humidity of five percentage units was required to offset a change in temperature of 1 degree.
When solar radiation was blocked by 70%, CCI values were reduced by 4 units. Therefore, equivalent values of CCI components are:
Temperature | Wind Speed | Relative Humidity |
1° | 2.5 mph | 5 percentage units |
These values are intended to serve as guidance to encourage visiting the Nebraska Mesonet or HPRCC websites once temperature, wind speed or relative humidity forecast are reviewed when assessing weather conditions.
Using a forecast and the CCI to make management decisions
A proposed approach would be to review the 10-day forecast daily. If temperatures are expected to reach past 77° F, this should prompt the user to consider relative humidity and wind speed. If relative humidity is expected to exceed 65% or if wind speed is expected to be slower than 10 mph, or both, the user should proceed immediately to review the CCI and consider deploying heat abatement strategies.
An application of this example, using the current 10-day weather forecast for Oakland, NE, shows 8 out of the 10 days with high temperatures above 77° F and average humidity above 60%. During this period, wind speeds are expected to range from 0 to 17 mph. On the hottest day (88° F) in the 10-day forecast, wind speeds are expected to be between 3 and 9 mph with average humidity at 71%. This should be the prompt to review the CCI forecast, expected to be at 100, and to prepare for severe heat stress on cattle.