Getting reacquainted with the Cattle Comfort Index (CCI)

July 21, 2025

Getting reacquainted with the Cattle Comfort Index (CCI)

By: Alfredo DiCostanzo, Nebraska Extension Educator, Ruth Woiwode, Nebraska Extension Specialist – Animal Care & Handling

Cattle Comfort Index Thresholds for Cattle

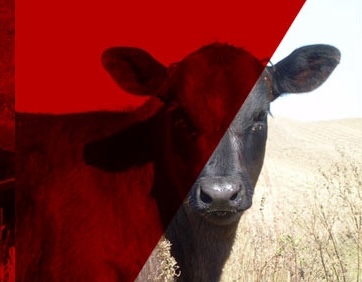
As temperatures rise, so does the risk of heat stress for feedlot cattle—affecting everything from health to performance and profitability. The Temperature Humidity Index (THI) provided producers with a guide to managing heat risk. 

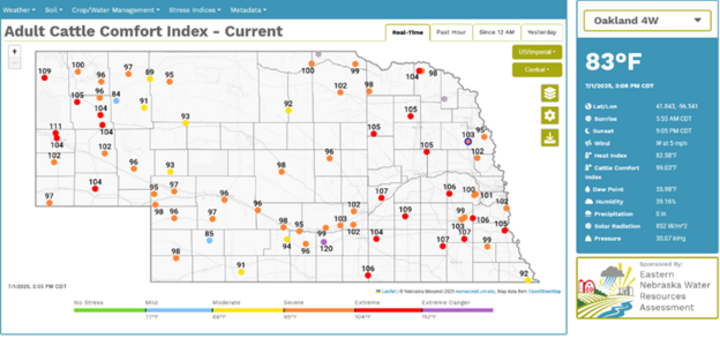
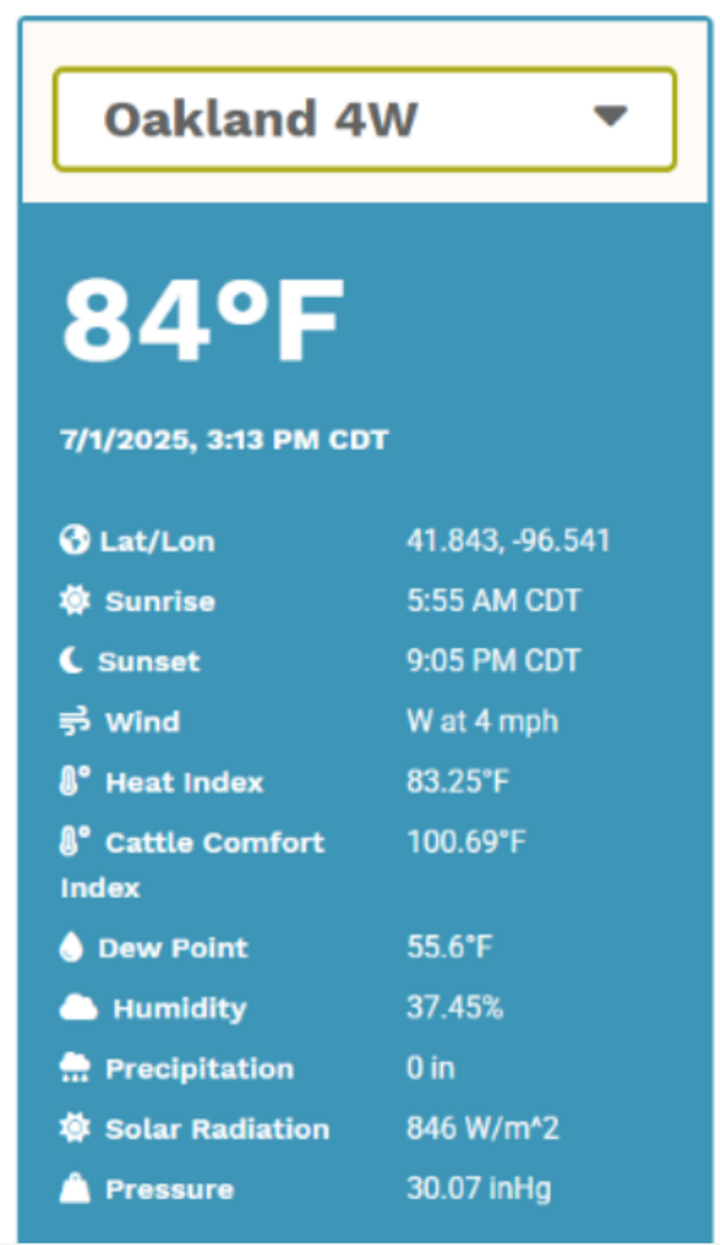
But now, the Cattle Comfort Index (CCI) is available for current conditions in a statewide map on the Nebraska Mesonet with sidebar access to each weather station (Figure 1) or as current and forecast conditions on the High Plains Regional Climate Center website (HPRCC; ) for each weather station (Figure 2).  

These tools are available through a collaboration between Nebraska Mesonet and HPRCC.  The CCI was developed by Dr. Terry Mader, University of Nebraska-Lincoln Animal Science Emeritus Professor, and collaborators while at the Haskell Agricultural Laboratory in Concord, Nebraska. 

The Cattle Comfort Index (CCI) includes: 

  • Wind speed 
  • Solar radiation (sun exposure) 
  • Air temperature 
  • Humidity 

Together, these factors offer a more accurate picture of what cattle experience—not just what the thermometer and hygrometer say. 

Why move beyond THI? 

While THI offers a basic snapshot of heat risk by combining temperature and humidity, it overlooks several critical environmental factors that affect cattle comfort and heat load.  

These variables combine to better reflect the actual conditions cattle experience, including the effects of both heat and cold stress. For example, at the same temperature and humidity, a hot, breezy day with cloud cover poses lower risk than a hot, still, sunny day—CCI captures that difference, while THI does not.  

Figure 1.  Map of current conditions displayed on the Nebraska Mesonet CCI tool.
Figure 1.  Map of current conditions displayed on the Nebraska Mesonet CCI tool. 


Figure 2. An example of the predictive capability of CCI on the HPRCC website.
Figure 2. An example of the predictive capability of CCI on the HPRCC website. 

How to start using CCI 

The current CCI is available as a statewide map or for each station.  

  1. Navigate to the Nebraska Mesonet website.
  2. Preview the CCI map (Figure 1).  
  3. For additional station-specific information, select the station on the right-side ribbon (Figure 3).  
Figure 3: station specific information
Figure 3. Nebraska Mesonet Station Selection 


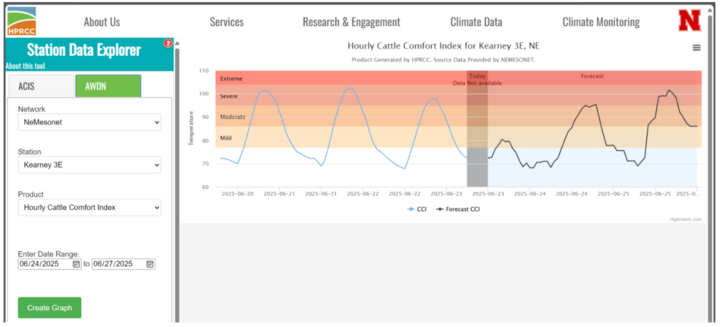
The current and forecast CCI are already integrated into the HPRCC website:  

HPRcc website example
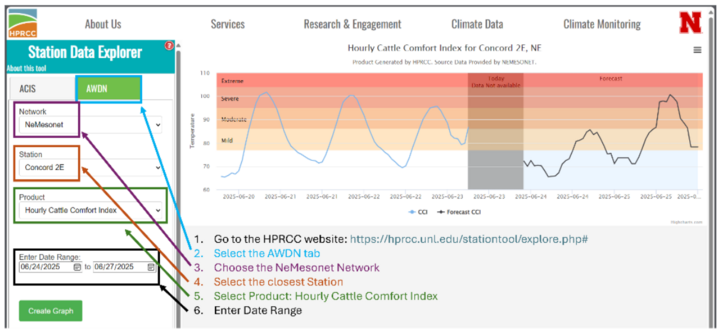
  1. Navigate to the HPRCC website: https://hprcc.unl.edu/stationtool/explore.php# 
  2. Select the AWDN tab (Figure 4) 
  3. Select Network: NeMesonet 
  4. Select Station/Location 
  5. Select Hourly Cattle Comfort Index 
  6. Enter Date Range  

Why CCI matters for your operation 

 Think of CCI as your early warning system specifically for livestock. 

  • Spot heat events sooner 
  • Make proactive decisions—adjust feeding, water access, or shade 
  • Reduce performance losses and death loss 
  • Provide animal comfort and enhance stress recovery 

Understanding and using CCI 

When Dr. Mader and collaborators developed the CCI, they used data from previous years on effects of weather events on cattle performance.  Heat stress in animals results from the cumulative effects of the factors modeled by the index and the capacity of each animal to respond to these.  

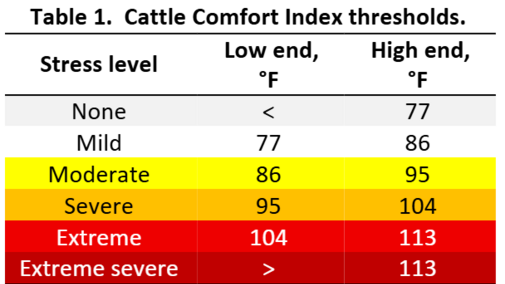
Using performance data and their observations, Dr. Mader and collaborators developed a set of CCI thresholds for heat stress.  They emphasized that these thresholds are arbitrary and may be shifted based on age, adaptation to thermal stress, insulation and fat content, size, shape and feed intake.  The original thresholds proposed by them are provided as guidelines in Table 1.   
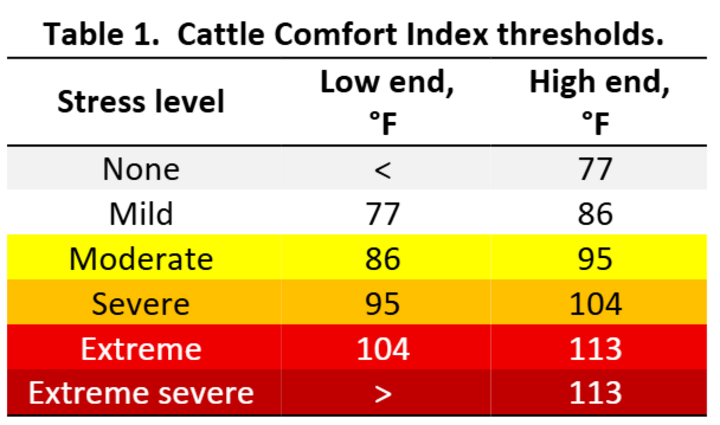
Table 1: Cattle Comfort Index thresholds

Simulating an event at 86° F in which there is no solar radiation protection or cloud cover and wind speed varies from 5 to 15 mph with relative humidity ranging from 30 to 70% results in a range of CCI from 90 to 106 (Figure 5; left panel).  Referring to Table 1 above, a CCI of 89 reflects mild heat stress while a CCI of 104 is indicative of extreme heat stress.  Incidentally, the July average maximum temperature in Northeast Nebraska is 86° F. 

Figure 5.  (Left panel): Cattle Comfort Index is simulated at 86° F in which there is no solar radiation protection or cloud cover, and wind speed varies from 5 to 15 mph in with relative humidity ranging from 30 to 70%.  (Right panel): Cattle Comfort Index is simulated at 86° F and solar radiation is blocked by 70%, wind speed is set at 10 mph with relative humidity ranging from 30 to 70%.
Figure 5.  (Left panel): Cattle Comfort Index is simulated at 86° F in which there is no solar radiation protection or cloud cover, and wind speed varies from 5 to 15 mph in with relative humidity ranging from 30 to 70%.  (Right panel): Cattle Comfort Index is simulated at 86° F and solar radiation is blocked by 70%, wind speed is set at 10 mph with relative humidity ranging from 30 to 70%. 

The results of this simulation demonstrate the negative effect of high humidity at the same temperature.  From Table 1 and Figure 5 (left panel), keeping wind speed at 5 mph and temperature at 86° F, demonstrated an increase in CCI from 98 to 101 to 104 corresponding to relative humidity at 30%, 50% or 70%, respectively.  

Similarly, from this simulation the effects of wind speed are noted.  Simulated increases in wind speed reduced the value of CCI from 98 to 89, from 101 to 93, or from 104 to 96 for relative humidity set at 30%, 50% or 70%, respectively.   

Lastly, this exercise demonstrates the positive effect of access to shade at 86° F with windspeed fixed at 10 mph and humidity ranging from 30% to 70%.  Blocking 70% of solar radiation (common when using commercial shade structures) reduced CCI by 5 units. 

CCI component tradeoffs  

Summers in the high plains are warm and humid, with solar radiation constant; therefore, windspeed represents the single factor that might make a difference in hot and humid days.  Given these conditions, and the fact that most folks rely on weather apps on their cellular devices to plan their day, understanding the relationships between CCI components may serve as an early prompt to review the CCI. 

Two series of simulations (one at full solar radiation and one with 70% solar radiation block) to determine CCI under various conditions were undertaken.  Simulations were generated with temperatures ranging from 76° F to 100° F in 2-degree increments while wind speed and relative humidity were permitted to vary from 5 to 15 mph or 30% to 85% in 5-unit increments.   

Under full solar radiation the following equivalencies were determined.  At the same relative humidity, CCI values were equivalent when a change in temperature of 1° F was offset by a change in windspeed of 2.5 mph.  Similarly, holding temperature constant, a change in windspeed of 5 mph was required to offset a change in relative humidity of 15 percentage units.  Lastly, holding windspeed constant, a change in relative humidity of five percentage units was required to offset a change in temperature of 1 degree.   

When solar radiation was blocked by 70%, CCI values were reduced by 5 units.  Therefore, equivalent values of CCI components are: 

Temperature 

Windspeed 

Relative humidity 

1° 

2.5 mph 

5 percentage units 

These values are intended to serve as guidance to encourage visiting the Nebraska Mesonet or HPRCC websites, once temperature, windspeed or relative humidity forecast are reviewed when casually assessing weather conditions on most cellular devices.  

A proposed approach would be to review the 10-day forecast daily.  

  • If temperatures are expected to reach past 80° F, then this is the prompt for the user to consider relative humidity and windspeed.  
  • If relative humidity is expected to exceed 65% or if windspeed is expected to be slower than 10 mph, or both, the user should proceed immediately to review the CCI.   

An application of this example, using the current 10-day weather forecast, shows a day with a high of 90° F with relative humidity of 60% and windspeed at 7 mph.  This should be the prompt to review the CCI forecast and to prepare for an expected CCI above 100 (extreme) and expected heat stress. 

As temperatures rise, so does the risk of heat stress for feedlot cattle, which CCI can be an early warning system for livestock.

Topics covered:

Backgrounding & feedlot, Cattle health, Weather

Online Beef Cattle Production

Master of Applied Science

Develop an understanding of beef production as a system and be exposed to alternative production practices that may enhance profitability and stewardship.

Graphic of cows in a field.

Explore our full collection of Beefwatch articles.

Explore Articles