This article was first published by "In the Cattle Markets" on March 2, 2022.
On Friday February 25th the USDA released the Cattle on Feed report. Average industry estimates were that there would be approximately 1% more cattle on feed February 1, 2022, approximately 1% less cattle placed on feed in January 2022, and 3% less cattle marketed in January 2022 (see February 25, 2022 edition of the Daily Livestock Report). The USDA report closely aligned with pre-report estimates: 1% higher for cattle on feed, 1% less cattle placed, and 3% less cattle marketed. Of note is that the February 1 cattle on feed was the largest since the USDA began collecting data in 1996 – a seemingly common occurrence as of late.
As was indicated in the February 14, 2022, edition of In the Cattle Markets, the February Cattle on Feed report provided a snapshot of the number of cattle and calves that were on feed and were marketed from cattle feedlots with less than 1,000 head. The report indicated that approximately 18% of the cattle and calves on feed were in feedlots that had less than 1000 head and accounted for approximately 13% of all cattle marketed. The 10-year average (2013-2022) is 18.3% of cattle on feed and 12.9% of marketings. For perspective, using USDA-NASS data, feedlots with less than 1000 head capacity represent 92.2% of all feedlots operating in the United States – down from 98.1% in 1996.
While the number of cattle on feed has been increasing to record levels, the weight cattle have been placed has changed in 2022 relative to the five-year average (2016-2020). Cattle weighing less than 700 lbs. account for 6.5% more of the cattle in Texas, 1.9% more of the cattle in Nebraska, and 1.2% more of the cattle in Kansas. More than 75% of this change came from feedlots moving away from 700-799 lb. feeder cattle. The remaining 25% came from feedlots moving away from 800+ lb. feeder cattle. Colorado was different having 1.18% more of the cattle in the 700-799 lb. weight class.
There are several factors that contribute to the placement weight decision of feeder cattle by feedlots. The two most important factors this year appear to be the deferred live cattle contracts and the price of corn. The deferred contracts of Oct’22 (143.125), Dec’22 (147.550), Feb’23 (150.925), and Apr’23 (153.225) all are providing signals to producers to increase placements but in deferred months. These contracts are pricing in potential drought, strong domestic beef demand, record export levels, feeder cattle prices, corn, and other input prices.
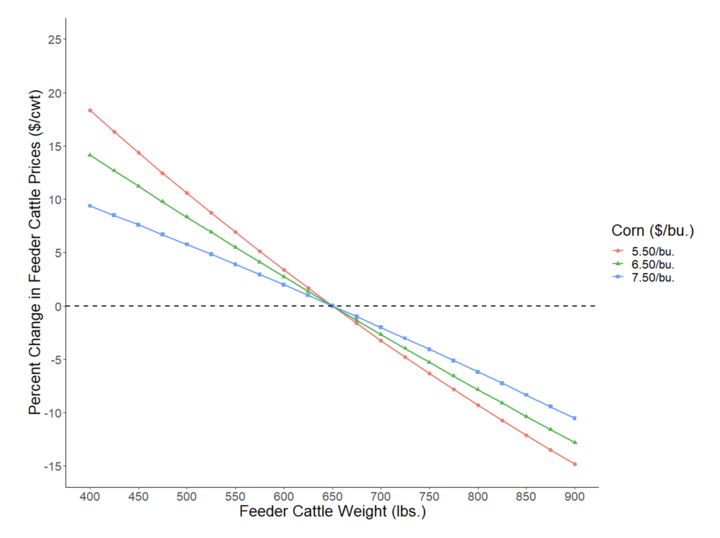
CME corn futures seem have only seemed to rise in both the nearby and deferred contracts. Rising corn prices are not necessarily an issue as long the live cattle futures likewise continues to rise. However, it does have an impact on the weight feedlots choose to place in the feedlot which in-turn affects the feeder cattle price-weight slide. The impact of higher corn prices on the feeder-cattle price-weight slide is well documented (e.g. Dhuyvetter and Schroeder 2000). Using their estimates and current live cattle prices, live cattle price volatility, corn price volatility, and projected corn prices of $5.50/bu., $6.50/bu., and $7.50/bu., Figure 1 shows what we could expect in the change of feeder cattle prices relative to a 650 lb. steer. For lower corn prices, feeder cattle prices will decline more rapidly as the weight increases. This occurs because when the corn price is lower, lighter weight feeder cattle are worth more relative to heavier weight because the cost of gain is low. Ultimately, the price-weight slide will adjust whether the corn market strengthens ($7.50/bu. corn) or weakens ($5.50/bu.).
So why could we see feedlots continue to place lighter feeder cattle? Feedlots want to place lighter cattle with higher feed prices due to cattle performance and ultimately total feed consumed. The decision to place lighter cattle has important implications for overall beef production, production timing, and feedlot profitability. Cattle that are placed in feedlots at lighter weights have lower average daily gain (ADG), lower feed conversions (AFC), longer days on feed, and lighter harvest weights. Table 1 is a compilation of cattle performance (ADG, AFC) in feedlots from academic literature by placement weight. One question is that given these performance parameters and feedlots desire to spend the same amount of money on feed costs (here consisting entirely of corn) regardless of different placement weights, is what would we expect harvest weights to be? Using 700-800 placement weights as the base, Table 1 reports the final weights that are solved for keeping total feed costs constant. Using final weights, total days on feed and gain in the feedlot are also calculated. This table implies that, assuming ADG and AFC are constant, the only way to reduce total feed costs would be to reduce harvest weights.
This has two broad industry implications for the quantity and quality of beef production. First, total quantity of beef production will likely decrease putting upward pressure on boxed beef and thus retail beef prices in deferred months. Second, smaller carcass weights are associated with more cattle grading USDA Select. As more cattle grade USDA Select, the Choice-Select spread will widen providing incentives to feed cattle longer to heavier harvest weights.
| Fixed | Calculated Solving for Final Weight: | ||||||
|---|---|---|---|---|---|---|---|
| Class | Placement Weight | ADG | AFC | Total Gain in Feedlot | Days on Feed | Estimated Final Weight | |
| ≤ 6cwt | 550 | 2.59 | 5.71 | 570 | 220 | 1120 | |
| 6-7cwt | 650 | 3.06 | 5.92 | 550 | 180 | 1200 | |
| 7-8cwt | 750 | 3.34 | 6.02 | 541 | 162 | 1291 | |
| 8-9cwt | 850 | 3.48 | 6.17 | 528 | 152 | 1378 | |
| ≥ 9cwt | 950 | 3.53 | 6.48 | 503 | 142 | 1453 | |
Source: Various academic publications representing mostly Southern Plains feeder cattle.
Note: Grayed area indicates the base scenario of feed consumed.
Interviews with the authors of BeefWatch newsletter articles become
Topics covered:
Backgrounding & feedlot, Feedlot, Corn, Marketing, budgets & management, Marketing & risk management