Conducting rangeland monitoring is an important task to help managers understand how rangeland management practices affect plant communities and soil health. A network of knowledge exchange between cattle producers and scientists can help this data become more meaningful and useful in an adaptive rangeland management framework. The Sandhills Rangeland Monitoring Cooperative (SRMC) is a new collaborative project between UNL Extension and cattle producers in the Nebraska Sandhills. The SRMC started in 2019 and aims to conduct and evaluate monitoring data on a growing number of ranches in the Nebraska Sandhills. The central idea is to connect ranchers, scientists, and the public in a network of ongoing knowledge exchange about rangeland health and management.
Seventy monitoring sites across seven ranches made up the 2019 SRMC monitoring season. Ranches were grouped into two regions (western Sandhills and central Sandhills). Monitoring occurred on four ranches in the western Sandhills with 36 upland study sites and three ranches in the central Sandhills with 34 upland study sites. At each ranch, 3 to 4 pastures were selected to represent the “typical” grazing management for the ranch. Within each pasture 3 study sites were selected at approximately 0.25 miles distance from water. All study sites were located on Sands ecological sites and represented upland dune tops and slopes. Lowlands and wet meadows, which are important components of the Nebraska Sandhills ecosystem, were not evaluated due to travel and time constraints.
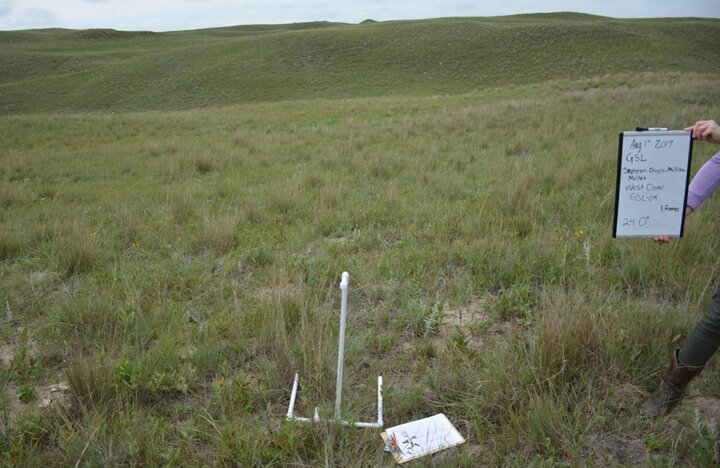
At each study site, we recorded the GPS location as a middle point and took photo points in three different directions (north, southwest, southeast, see Fig. 1). Moving away from the center point in the three directions, a monitoring frame was placed every two steps and vegetation and ground cover was recorded for 11 monitoring frame placements per direction. A total of 99 frames were measured for each pasture. Within each frame, percent ground cover, plant species frequency of occurrence, and plant species dry weight rank were measured. Forage production by clipping inside exclosure cages was also carried out on some of the ranches. Elevation, aspect, slope, ecological site description, and current and long-term weather data were also collected for each site.
Interpreting monitoring data can help detect changes in plant communities over time and highlight plant response to grazing management strategies. This data can be interpreted and compared with a target plant community in the NRCS state and transition models for the ecological site being monitored (more information on specific ecological sites can be found at https://edit.jornada.nmsu.edu/). Compiled data of multiple sites in a similar region can also be used to compare a single site’s values with the averages, maximums, and minimums in that region. In this way, deviations from specific management goals can be detected early and help in reassessing management decisions.
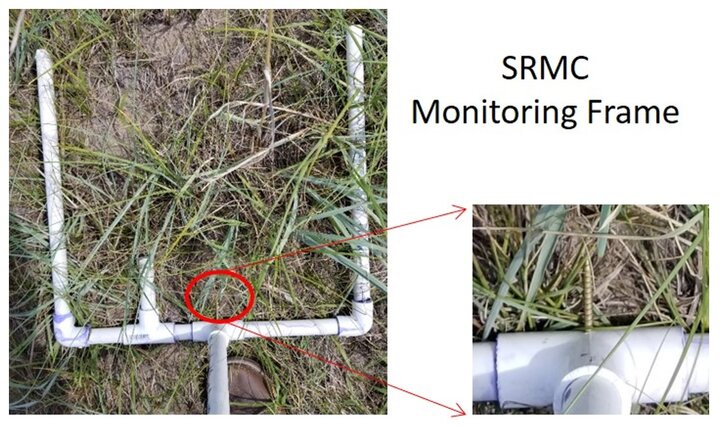
Percent cover is an important indicator of rangeland health that can be analyzed across seasonal and yearly differences in precipitation and grazing utilization. When bare ground is prevalent or increases over years it suggests an area may be at greater risk for wind and water erosion. We quantified ground cover at SRMC sites by identifying what was directly underneath the tip of a cover point (a wood screw) located on the monitoring frame (Fig. 2). We identified what was observed as litter, bare ground, or the plant base of live vegetation. If we recorded a live vegetation cover point, we recorded the species. From these observations, we calculated percent ground cover. When looking at ground cover data, the percent of bare ground in relation to litter or live plants provides valuable information about the amount of ground that may be lacking adequate cover. For example, if a site is reaching 40-50% bare ground, and the range management goal is to increase ground cover, then management practices should be employed that leave more litter or improve vegetation diversity and abundance. Management practices to consider include adjusting stocking rate, increasing rest time, and/or altering timing of grazing. However, having some sites with more bare ground is not always a negative. Areas with greater amounts of bare ground provide important habitat for wildlife, insects, and specific plants (e.g., Blowout penstemon).
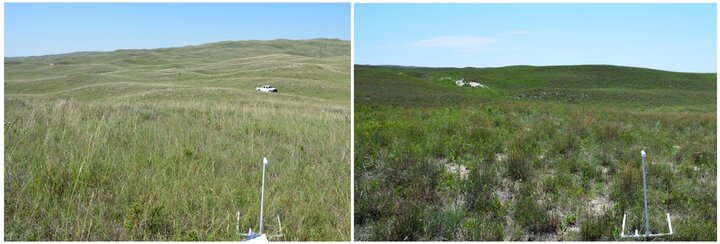
Monitoring rangelands provides critical insight to assist in managing for defined plant conditions in specific areas. The photos in Figure 3 show two sites in the central Sandhills, one with 9% bare ground (left) and the other with 42% bare ground (right). The 42% bare ground site has soil patches exposed along the monitoring transect visible in the photo. Yearly photo points at the same location can help monitor the spread or reduction of bare ground at a specific location. Photo points cannot show every detail along the transect but are helpful in comparing year after year changes in bare ground under different management strategies. Keeping detailed monitoring records (e.g., cover and plant species transect) at a few locations will help in monitoring rangelands visually as you drive through pastures at different times of the year.
The SRMC will continue to collect data over the next few years. To learn more about the project and to follow along with the results please visit the SRMC website at https://spark.adobe.com/page/EkDaaEdOVwCXG/. This site will be updated with more data at the conclusion of each growing season. If you have questions about setting up a rangeland monitoring program or the SRMC project, please contact Kayla Mollet (kmollet2@unl.edu) or Mitch Stephenson (mstephenson@unl.edu).
Interviews with the authors of BeefWatch newsletter articles become available throughout the month of publication and are accessible at https://go.unl.edu/podcast.